
Frequency Modulated Spectroscopy
| Chemical Dynamics Home |
| News |
| Research Themes |
| Research Methods |
| VMI |
| LIF |
| MB |
| CMB |
| FMS |
| ToF |
| People |
| Jobs |
| Links |
| |
Last updated February 2026 |
FMSFrequency-modulated spectroscopy is a sensitive high resolution absorption technique. A simple way of understanding the advantage it offers is the analogy to AM/FM radio. You can think of conventional absorption spectroscopy, where the small change in the intensity of the transmitted light is measured as the laser frequency is scanned across a transition as amplitude modulated, or AM. It is hard to measure small changes in the (large) intensity of the laser, and so the signal is noisy, as usually observed in AM radio. Frequency modulation works by rapidly varying the frequency of the light around the central 'carrier' frequency. Absorption then shows up as changes in this frequncy component, which may be isolated electronically. The resulting signal is largely insensitive to variations in the laser intensity, and thus has much higher signal to noise, as in the much less noisy FM radio. 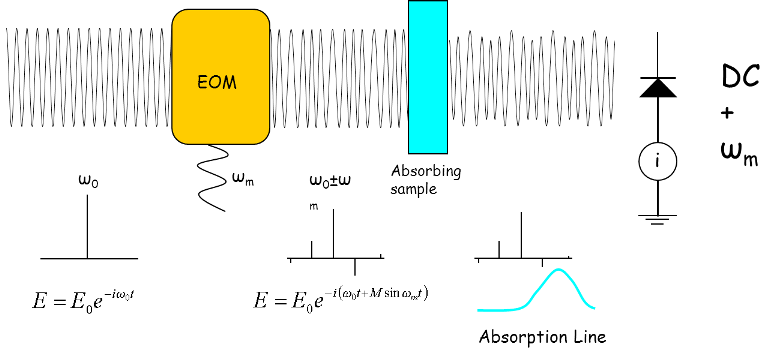
In more detail, the probe laser produces very narrow bandwidth (< 10 MHz) continuous-wave radiation, which may be represented as a single carrier frequency, ω0. An electro-optic phase modulator modifies the probe beam in a way that may be represented as shifting some of the optical power into sidebands, evenly spaced around the carrier frequency in integer units of the applied modulation frequency, ωm. The intensities of the sidebands are determined by how large a voltage is applied to the modulator. The sidebands alternate in phase, with the result that the overall envelope of the FM electric field remains constant. The square of the envelope is what is detected by a 'square-law' detector such as a photo-receiver, so a pure phase-modulated beam will only give a DC signal related to the overall beam intensity. One way to view this is to see that the carrier and the lower frequency side-band will generate a beat frequency at ωm on the detector, but the higher frequency side-band will also beat with the carrier to generate a ωm frequency signal of opposite phase. These two beat signals will perfectly cancel as long as there is no difference between the sidebands. However, if the symmetry of the sidebands is broken, by preferential absorption/gain or dispersion of one of the sidebands, then the resulting field envelope is amplitude modulated at the applied modulation frequency - one of the beat signals is observed. The detector thus sees both a DC signal and a component oscillating at the modulation frequency, ωm. This beat frequency signal may be electronically isolated and demodulated, providing a zero-background and high sensitivity spectroscopic technique, which can measure both absorption and dispersion. When we use FMS in an experiment with a definite start time, for example when the molecule we probe has been generated by photolysis with a nanosecond pulsed laser, we can take advantage of the continuous-wave probe laser to record the time evolution of the signal for each photolysis pulse, performing transient FMS. Since we use very narrow-band cw-lasers for FMS, with a typical bandwidth of 1 MHz, our spectroscopy is inherently sub-Doppler, compared to a typical thermal Doppler linewidth of 1-2 GHz in the NIR. FMS provides us with an excellent tool to measure the Doppler lineshape of transitions arising from individual rotational quantum states, and hence measure the molecular velocity distribution for that state. Transient FMS thus allows us to measure the evolution of such lineshapes and velocity distributions as a function of time. As an example the figure below shows a FM Doppler lineshape for the collisional thermalisation of CN(X2π) with Ar atoms. The CN was generated by the 266 nm photolysis of ICN, with an initial speed of 1500 ms-1. As it collides with the Ar atoms it relaxes to a Maxwell-Boltzmann distribution of speeds with a 296 K temperature in about 1.5 μs. 
|
|